Forages Under Drought
Here in New Hampshire, we don’t often think of water as a limiting resource. More typically, it’s our short growing season and rocky soils that are the more challenging concerns. However, recently, rainfall seems like it’s becoming more unpredictable. You no doubt noticed how dry the 2020 growing season was, not only in terms of our low seasonal rainfall total, but also in terms of how long we went without any relief. Whether you grew vegetables at home, or managed acres of hayfields, you were probably dealing with very thirsty plants. At UNH’s Kingman Research Farm we were also dealing with thirsty plants. In the spring of 2020, our agroecology research team was managing a perennial forage experiment that was going into its second growing season. As spring gave way to summer, and the rainfall still refused to come, we grew concerned as we watched the soils dry and the forage growth slow. Our concern grew as the forage legumes began maturing and flowering earlier than normal, as if they were giving up for the season, and as the grass blades curled and the fields began to turn brown. By the end of the growing season, we wondered if our perennial forage experiment would even survive. Then we began to wonder, if it did survive, could it tell us something useful about how perennial forages might be managed to make them more resilient to drought? Here we share some insights from the great drought of 2020 and what we have learned from our experiment to this point.
Following a relatively normal winter and early spring, May 2020 was the first month when rainfall totals fell below average. Monthly rainfall totals remained below average until October, essentially the entirety of the growing season (Figure 1). Specifically, each month during that span was approximately 2 inches below the normal rainfall, so over the course of the growing season we only received about half of what we would normally expect (only 12 inches of the normal 24 inches of rainfall, May to October).
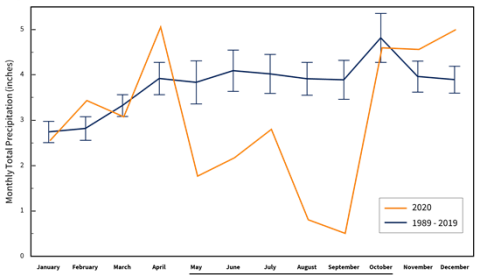
Figure 1. The total amount of rainfall in each month of 2020 (orange) compared to the average of the previous 30 years at UNH Kingman Research Farm in Madbury, NH (error bars are plus or minus the standard error, showing the range of precipitation commonly seen each month for the last 30 years). The six-month total deficit from May through October was 11.9 inches. The “normal” amount of rainfall for this period is 24.5 inches.
Droughts are not unheard of in our region, of course. Nor are abnormally wet growing seasons. And there is a case to be made that “abnormal” is becoming the new normal (for example, July 2021 was one of the wettest Julys on record, and the 2021 growing season was one of the longest). Over the last five years, we have experienced below-average rainfall in the months of May, June, and September for four of those five years (Figure 2). Prior to 2020, the driest growing season in recent memory was 2016, but that drought was not sustained throughout the entire growing season. The drought of 2020 was different from 2016 because rainfall was below average for six consecutive months, leading to a very noticeable moisture deficit.

Figure 2. The change in precipitation relative to the average rainfall of the previous 30-years for each month over the past 5 years at the UNH Kingman Research Farm in Madbury, NH. Values at “0” indicate no change from historical norms. While 2016 rainfall each month (light grey bars) was below normal for several months during the growing season, the monthly deficit was not as severe or as persistent as what we experienced in 2020 (orange bars).
Soil moisture is just one piece of the drought picture. Air temperature is also an important factor contributing to plant stress. Interestingly, monthly mean temperatures during the 2020 growing season followed the 30-year trend pretty closely (though not necessarily for the winter months, which were warmer than average) (Figure 3). We don’t think that unusually high or low temperatures during the growing season contributed to the plant responses we saw that year.
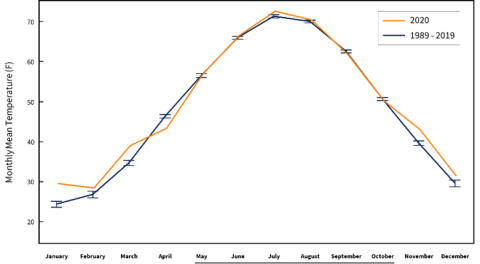
Figure 3. Monthly mean temperatures for each month of 2020 (orange) compared to the monthly means of the previous 30 years at UNH Kingman Research Farm in Madbury, NH (error bars are plus or minus the standard error, showing the range of monthly temperatures commonly experienced each month for the last 30 years). Note warmer than average temperatures during the winter months in 2020.
Our Perennial Forage Legume Experiment
We established a field experiment involving four perennial forage legumes at the UNH Kingman Research Farm in the fall of 2018. The perennial legumes are alfalfa, birdsfoot trefoil, white clover, and red clover, and each is grown with orchardgrass. We are evaluating how two aspects of forage harvesting: cutting frequency—3 cuts per season versus 5 cuts per season—and cutting height—leaving a 5 cm (2 inch) versus 10 cm (4 inches) residual forage height—affect the dynamics of grass-legume mixtures over each growing season and across years. The cutting frequency treatments roughly mirror a traditional haying approach and an intensive grazing approach, each made slightly more or less intensive by the lower or higher cutting heights. The goal of the experiment is to understand how these harvesting practices (or more generally “harvest intensities”) might affect the productivity and longer-term persistence of the perennial legumes when growing in a stand mixed with grass, as well as the balance between the legume and grass components of the harvested forage.
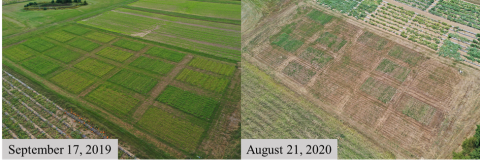
Figure 4. Overhead photos of the perennial forage legume experiment at the UNH Kingman Research Farm in Madbury, NH. The photo on the left was taken in the first full year of the study, while the photo on the right shows the same plots during the height of the drought in the second year of the study.
The unexpected drought of 2020 also allows us to ask whether certain of these harvest practices might improve the resilience of legume-grass stands to extreme drought conditions and whether specific forage legumes respond differently than others. Because the first harvest of each year always includes all the plots in the experiment, we chose to examine data from that harvest period only. In addition, we expect the first harvest of each year to be most reflective of the stand’s response to the previous season’s management practices and growing conditions and their combined effects on overwinter survival. We restricted our examination to just two of the perennial legumes, white clover and red clover, because these species established most successfully at the beginning of our study.
What do our data tell us about the resilience of perennial forage legumes to severe drought?
White clover is shallow rooted; therefore, we suspected it might have the strongest negative response to the drought. White clover was abundant in the first harvest in both 2019 and 2020, particularly where cutting heights were set closer to the ground (Figure 5). We think the high overall abundance of forage in the first cut of 2020 was because the spring started out quite wet (Figure 1) and the drought had not yet set in by the time we conducted our first harvest. While we don’t show the data here, you can be assured that subsequent harvests that year fell off dramatically. The first harvest of 2021 is what we are really interested in here, because it reflects the cumulative effects of the previous year’s drought. As you can see in Figure 5, the first harvest of 2021 contained very little white clover and there is no clear indication that any of our harvest practices enabled it to maintain its abundance coming out of the 2020 drought.
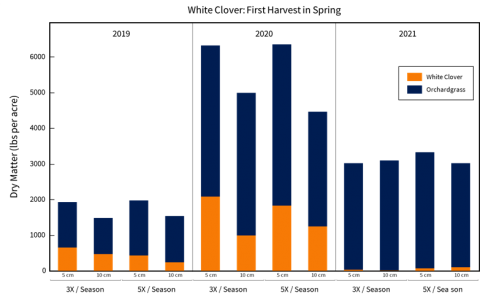
Figure 5. Abundance of white clover and orchardgrass in the first harvest of each year.
Although red clover can produce very deep tap roots (in some cases 3 to 9 feet!), which may help make it more resilient to drought stress, the majority of its roots are lateral and within the top 5 inches of soil. Like white clover, red clover also did well in the first harvests of 2019 and 2020 (Figure 6). After the drought, the proportion of red clover in the first harvest of 2021 was much reduced, although not to the extent that we observed with white clover. Among the harvest management treatments, those that left a 5 cm (2 inch) residual forage height seemed to favor red clover, particularly in the less frequently harvested system (i.e., 3 cuts per season).
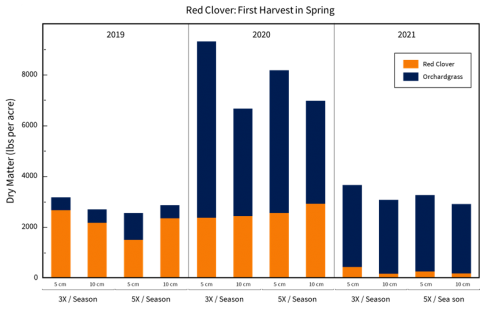
Figure 6. Abundance of red clover and orchardgrass in the first harvest of each year.
Takeaways
Severe droughts, like the one we experienced in 2020, are likely to become more frequent in the future. Results from our study suggest that harvest practices may influence how well some perennial forage legumes recover from an extended period of drought. Red clover appeared to be more drought-tolerant than white clover, and more responsive to our harvest treatments; however, we still need to analyze the data from subsequent harvests that were conducted over 2021 and will likely continue to experiment for at least another year or two. At the end of the day, drought resilience in forages will depend on many factors, most of which were not examined in this experiment. These include soil type and health, fertility regime, cultivar or variety, disease pressure, etc. Certainly, species selection remains one of the most important factors in establishing and maintaining resilient forage stands in the face of environmental stress – unfortunately it can be increasingly hard to know what types of stress to expect. If variable weather is our new normal it will become essential that we identify approaches to managing forages that increase their resilience to extreme weather events.
This project is funded by grants administered by USDA NIFA programs ORG (Project No. 2016-51106-25713), OREI (Project No. 2020-51300-32196), and HATCH (Project No. 100682). We are grateful for the technical support provided by personnel at NHAES (Evan Ford and Kyle Quigley), UNH (Andre Brito, Natalie Lounsbury, Julia Hobbie, Isaac Ativor, Lauraine Chevalier, Elizabeth Cain, Ben Nikitas, and Ben Fehr), and UVM (Sid Bosworth and Allen Wilder). Historical weather data from the National Centers for Environmental Information – Climate Data Online (Station USC00272174).
Author(s)

Nicholas Warren
Research Scientist I
Natural Resources and the Environment
UNH College of Life Sciences and Agriculture
Email: Nicholas.Warren@unh.edu

Richard Smith
Associate Professor
Natural Resources and the Environment
UNH College of Life Sciences and Agriculture
Email: Richard.Smith@unh.edu