LiDAR: The Up-and-Coming Tool for Just About Everything
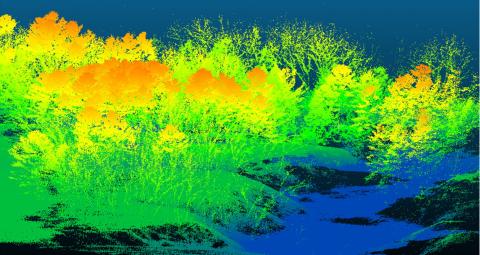
Figure 1 (header image). High-resolution LiDAR image showing a multi-level forest adjacent to a stream channel. Color shown to represent total elevation. Image courtesy of F. Sullivan. See footnote.
Light detection and ranging, commonly known as LiDAR, is the hottest new technology in the forestry world. LiDAR data has numerous potential uses for mapping, tree measurement and forest management planning. LiDAR technology also has quite a few uses outside of forestry. It is used to guide self-driving cars, identify Native American archaeological sites and even land (future) spacecraft on Mars! All that said, what is LiDAR, anyway?
LiDAR 101
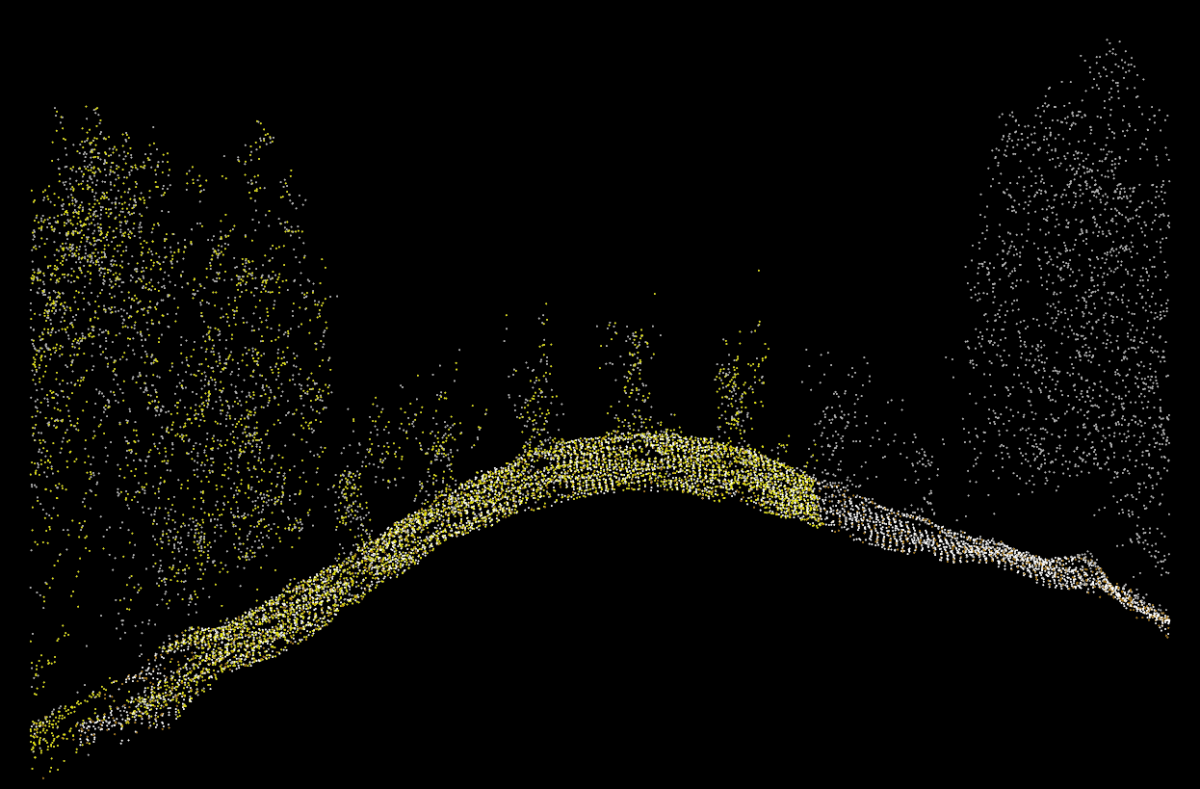
At its most basic, LiDAR data is just a series of highly accurate recorded locations. The data is collected by a sensor that sends out a pulse of light in the near infrared spectrum. When the pulse encounters any solid object, it bounces back to the sensor, which records the time it took for the pulse to travel to the object and back. That travel time, along with information about the location and orientation of the sensor, is then used to calculate where the object is in relation to the sensor. By repeating this simple process millions of times per minute as it rotates, the sensor creates a 3D model of the world around it. The resulting model consists of a large group of individual point locations, and is referred to as a “point cloud” (see Figure 2).
There are a number of ways to collect LiDAR point clouds. LiDAR sensors can be mounted on tripods to create a 360° model of an individual location. More commonly, sensors are mounted on unmanned aerial vehicles (e.g., drones), airplanes and even satellites to create point clouds that look down at the earth from different scales. Some of these sensors collect a small number of sparsely distributed points, while others collect dozens or hundreds of points per square meter. In each scenario, the data processing varies, but the underlying principles are the same.
Potential Uses
Once the data is collected, it can be used to create an amazing array of different products. A few examples include:
- In any point cloud collected using an airborne sensor, the most common object a pulse can encounter is the ground. These points can then be used to generate high-resolution maps of land elevation, called Digital Elevation Models (DEMs). DEMs show a “bare earth” landscape where trees, buildings and other objects are filtered out of the data, and are used to help plan forest management activities, assess water flow and inform the design of roads, bridges and buildings.
- Data collected over forested areas will show returns at each level of the forest from the top of a tree’s canopy, to lower branches, to saplings and shrubs in the understory. The distribution of these returns can be used to evaluate the average height and diameter of individual trees, overall density of forest stands and forest carbon stocks.
- In urban areas, LiDAR data can be used to map individual tree canopies to help municipalities plan for the care and maintenance of street trees.
LiDAR Data Available for NH
With all the potential uses for LiDAR data, there has been significant interest in developing a freely available dataset for use in the Granite State. A collaboration involving numerous partners has resulted in a dataset covering more than 85% of New Hampshire. Pre-processed data products are available for use at GRANIT View, an online mapping program operated by the Earth Systems Research Center at the University of New Hampshire. For those interested in learning to use GRANIT View to access LiDAR data, UNH Cooperative Extension is hosting a series of workshops this spring, with sessions in Manchester on April 1, Albany on April 2 and Plymouth on April 12.
Case Study: LiDAR for Mapping Stone Walls
At first glance, LiDAR data can look like a moonscape: there are hills and valleys, and not much else. However, upon closer inspection some patterns do emerge. Figure 3 shows two images of the same location: a color photo taken by an airborne camera and a hillshade model derived from LiDAR data. Looking closely at the LiDAR image, you can see farm fields, an orchard, skid trails for logging, and several long, linear features crisscrossing the image. Those linear features are some of New Hampshire’s famous granite infrastructure: stone walls.
The NH Geological Survey and NH GRANIT, along with a host of volunteers, are using LiDAR to map New Hampshire’s stone walls. The NH Stone Wall Mapper is an online tool where volunteers can identify stone walls using a combination of aerial imagery, LiDAR data, and good old-fashioned field observations. This project is an attempt to catalog an important historical resource unique to the New England landscape. Whether you want to map the walls in your own backyard or along a favorite hiking trail, try out NH Stone Wall Mapper to help identify these beautiful landmarks today!
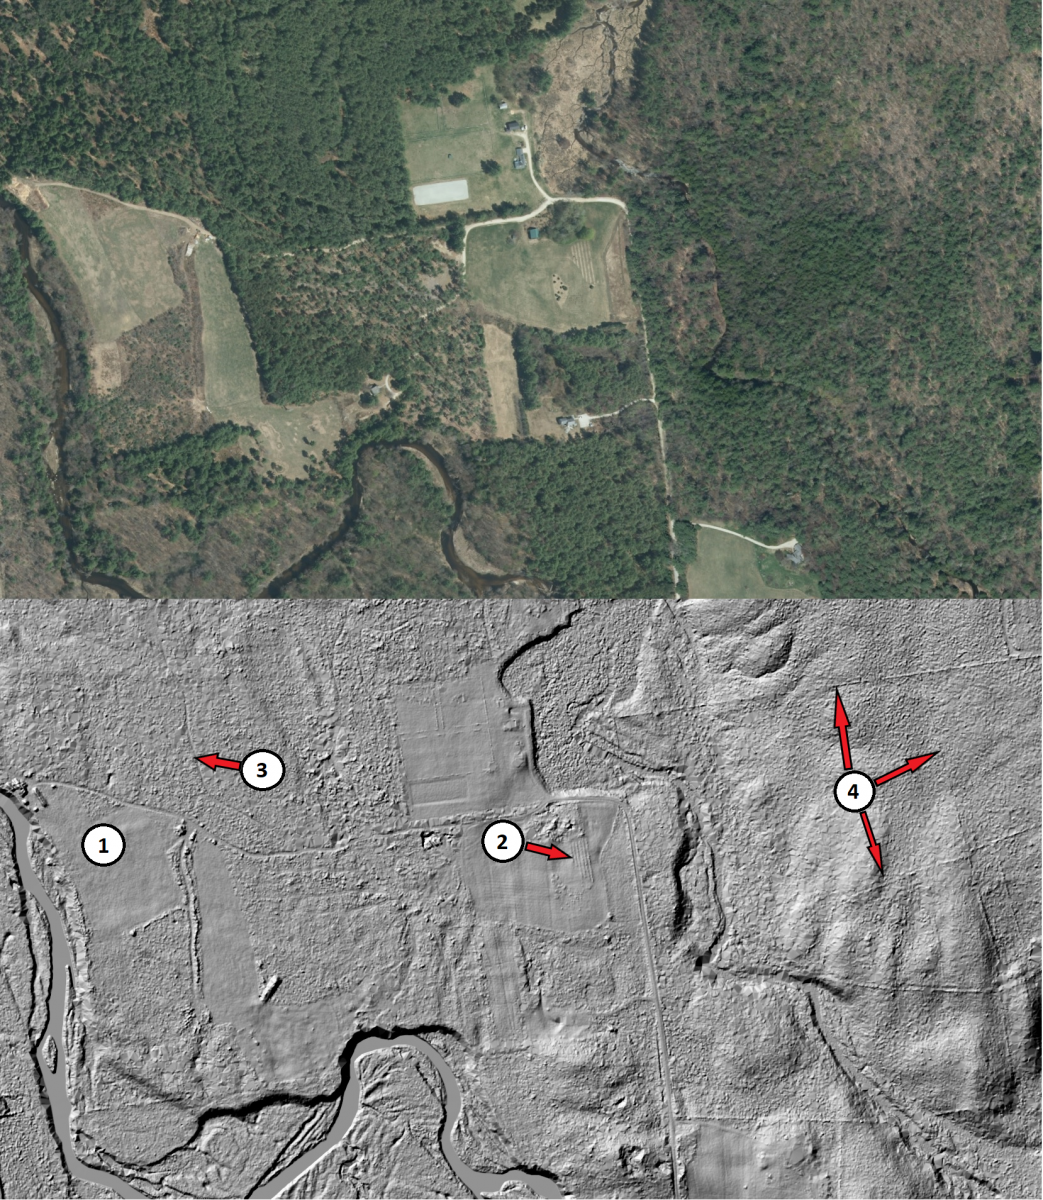
Figure 1 footnote: This material is based upon work supported by the Broad Agency Announcement Program and the Cold Regions Research and Engineering Laboratory (ERDC-CRREL) under contract number W913E5-18-C-0005. Any opinions, findings, and conclusions or recommendations expressed in this material are those of the author(s) and do not necessarily reflect the views of the Broad Agency Announcement Program and the Cold Regions Research and Engineering Laboratory (ERDC-CRREL).